-
Northstar#1 Location Map
Location of Northstar #1 salt water disposal well approximately 3.5 km northwest of Youngstown, Ohio. Disposal operations in Northstar #1 started in December 2010. Purple circles represent epicenters of earthquakes related to injection in the well (Kim, 2013). The seismicity occurs at a depth of approximately 700 m below the well (total depth = 2802 m). They appear to occur in a series of en echelon east-west trending clusters 3.5 to 4 km deep with the largest event of the sequence (Mw 3.9) occurring in December 2011, approximately 800 m west of the well. The closest permanent seismograph station is YSUO at Youngstown State University.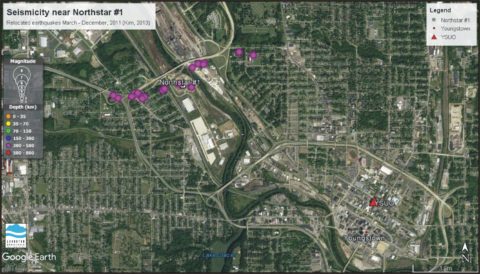
Location of Northstar #1 salt water disposal well approximately 3.5 km northwest of Youngstown, Ohio. Disposal operations in Northstar #1 started in December 2010. Purple circles represent epicenters of earthquakes related to injection in the well (Kim, 2013). The seismicity occurs at a depth of approximately 700 m below the well (total depth = 2802 m). They appear to occur in a series of en echelon east-west trending clusters 3.5 to 4 km deep with the largest event of the sequence (Mw 3.9) occurring in December 2011, approximately 800 m west of the well. The closest permanent seismograph station is YSUO at Youngstown State University.
-
nstar_stress
Geomechanical analysis of natural fractures in the Northstar #1 well. An analysis of the stress state on the fractures observed in the Northstar well given the orientation of maximum horizontal stress in northeast Ohio shows that the east-west striking left-lateral fault identified in the earthquake analysis by Kim (2013) is at a critical stress state. A change in pore pressure on the fault of 24 psi is sufficient to cause slip. The colors of the fault planes in the stereonet and the cricles in the Mohr diagram are keyed to the stress required to fail, dark red for the fault plane most favorably oriented to slip grading to green for the orientations least likely to slip.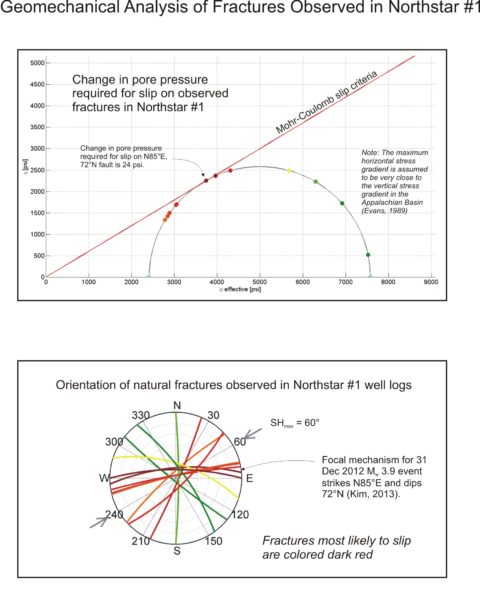
Geomechanical analysis of natural fractures in the Northstar #1 well. An analysis of the stress state on the fractures observed in the Northstar well given the orientation of maximum horizontal stress in northeast Ohio shows that the east-west striking left-lateral fault identified in the earthquake analysis by Kim (2013) is at a critical stress state. A change in pore pressure on the fault of 24 psi is sufficient to cause slip. The colors of the fault planes in the stereonet and the cricles in the Mohr diagram are keyed to the stress required to fail, dark red for the fault plane most favorably oriented to slip grading to green for the orientations least likely to slip.
-
Northstar#1 Permeability Model
Cross-section of permeability model for the Northstar #1 reservoir simulation. The simulation includes the target formation in the Mt Simon Sandstone, a highly permeable layer at the base of the Cambrian and top of the Precambrian (ODNR, 2012), a system of 10 x 10 m hydraulically conductive vertical faults that intersect the bottom of the Northstar well (ODNR, 2012; Raziperchikolaee and Miller, 2015) and the hypothesized east-west striking left-lateral fault identified by Kim (2013) based on a focal mechanism and epicentral alignments. The permeability of the Paleozoic section (light blue) is 1 mD horizontal and 0.1 mD vertical and the Precambrian crystalline basement is 0.1 mD (isotropic).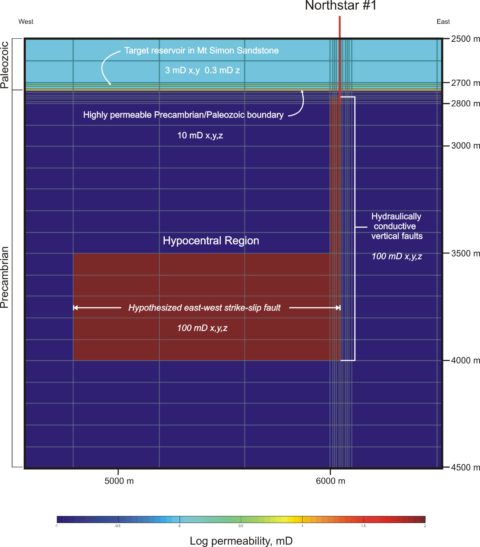
Cross-section of permeability model for the Northstar #1 reservoir simulation. The simulation includes the target formation in the Mt Simon Sandstone, a highly permeable layer at the base of the Cambrian and top of the Precambrian (ODNR, 2012), a system of 10 x 10 m hydraulically conductive vertical faults that intersect the bottom of the Northstar well (ODNR, 2012; Raziperchikolaee and Miller, 2015) and the hypothesized east-west striking left-lateral fault identified by Kim (2013) based on a focal mechanism and epicentral alignments. The permeability of the Paleozoic section (light blue) is 1 mD horizontal and 0.1 mD vertical and the Precambrian crystalline basement is 0.1 mD (isotropic).
-
Change in Cell Pressure March 2011
Change in cell pressure at the end of March 2011. In March 2011 the change in cell pressure from initial state has reached 40 psi in the hypocentral region closest to the conductive faults. This exceeds the 24 psi pore pressure change required for failure on the east-west fault. Two earthquakes (magenta circles) were recorded in March 2011 (Mw 1.8 and 2.3; Kim, 2013). Note that the colorbar for the cell pressure is truncated at 150 psi to show the details of the distribution of pressure. The change in pressure in the cells closest to the borehole is much higher than 150 psi.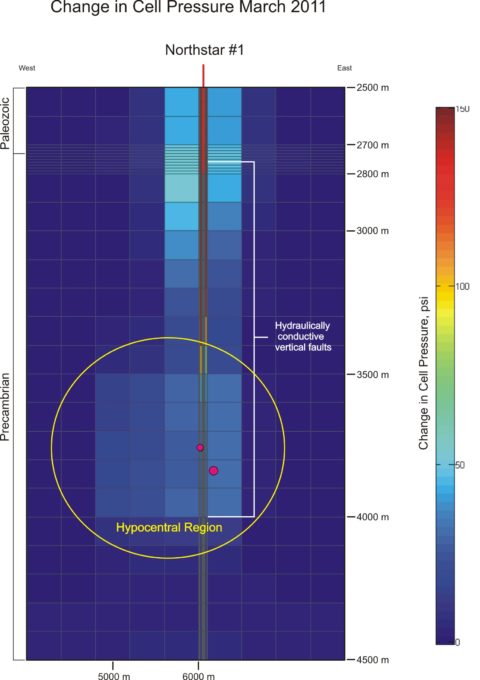
Change in cell pressure at the end of March 2011. In March 2011 the change in cell pressure from initial state has reached 40 psi in the hypocentral region closest to the conductive faults. This exceeds the 24 psi pore pressure change required for failure on the east-west fault. Two earthquakes (magenta circles) were recorded in March 2011 (Mw 1.8 and 2.3; Kim, 2013). Note that the colorbar for the cell pressure is truncated at 150 psi to show the details of the distribution of pressure. The change in pressure in the cells closest to the borehole is much higher than 150 psi.
-
Change in Cell Pressure September 2011
Change in cell pressure at the end of September 2011. By September 2011 the seismic activity has increased and started to migrate to the west along the hypothesized strike-slip fault. The change in cell pressure well exceeds the 25 psi pore pressure change required for failure. The March 2011 earthquakes are shown in white and the events that occurred since then are shown in magenta. Note that the asymmetry in cell pressure above the hypocentral region is due to the anisotropy in the petrophysical model.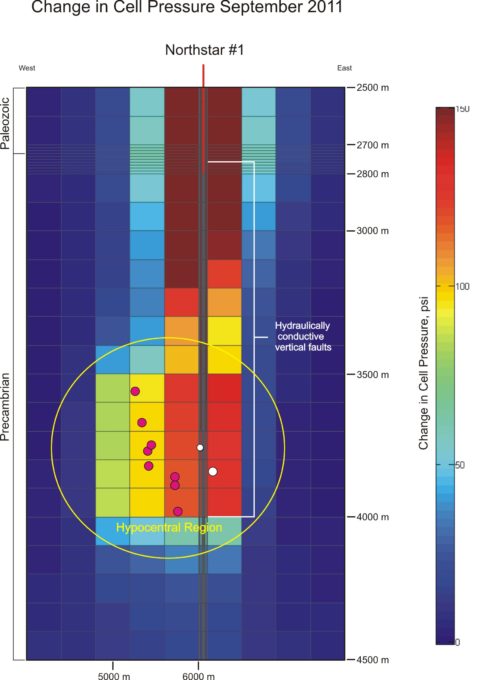
Change in cell pressure at the end of September 2011. By September 2011 the seismic activity has increased and started to migrate to the west along the hypothesized strike-slip fault. The change in cell pressure well exceeds the 25 psi pore pressure change required for failure. The March 2011 earthquakes are shown in white and the events that occurred since then are shown in magenta. Note that the asymmetry in cell pressure above the hypocentral region is due to the anisotropy in the petrophysical model.
-
Change in Cell Pressure December 2011
Change in cell pressure at the end of December 2011. By December 2011 the seismic activity (magenta circles) continues to migrate to the west. The largest earthquake of the Northstar sequence occurred in December (Mw 3.9; Kim, 2013) a day after the well operator received an order from ODNR to cease operations (ODNR, 2012).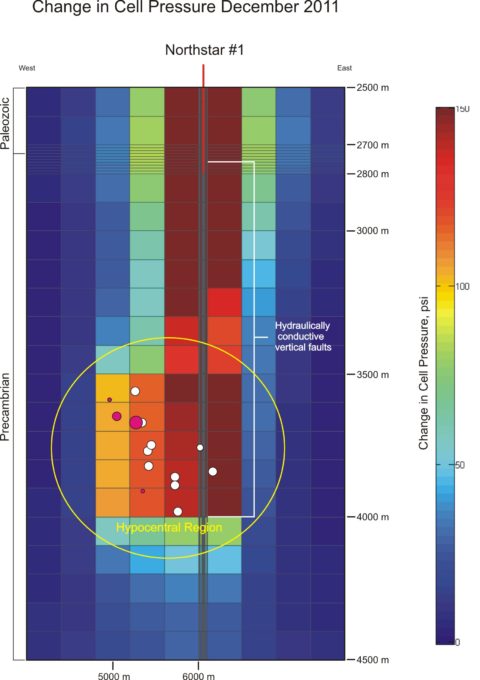
Change in cell pressure at the end of December 2011. By December 2011 the seismic activity (magenta circles) continues to migrate to the west. The largest earthquake of the Northstar sequence occurred in December (Mw 3.9; Kim, 2013) a day after the well operator received an order from ODNR to cease operations (ODNR, 2012).
-
Change in Cell Pressure January 2012
Change in cell pressure at the end of January 2012. Following the shut down of the Northstar #1 well pressure slowly starts to dissipate in the area around the well. A network of portable seismographs deployed by LDEO in December 2011 continued to record small earthquakes through January 2012 (Kim, 2013). These events are thought to have occurred on an en echelon fault located northeast of the Northstar well (and out of the plane of the cross-section).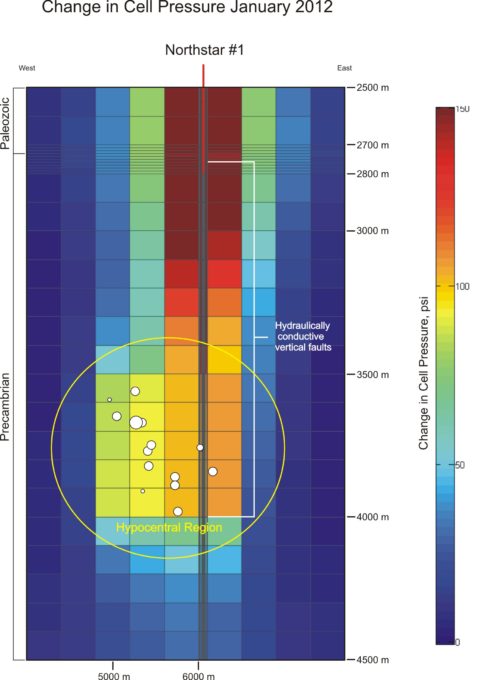
Change in cell pressure at the end of January 2012. Following the shut down of the Northstar #1 well pressure slowly starts to dissipate in the area around the well. A network of portable seismographs deployed by LDEO in December 2011 continued to record small earthquakes through January 2012 (Kim, 2013). These events are thought to have occurred on an en echelon fault located northeast of the Northstar well (and out of the plane of the cross-section).
Numerical Modeling of Fluid Injection in Northstar #1 UIC Class II Well, Youngstown, Ohio
From January 2011 to February 2012 over a hundred small earthquakes occurred in a formerly seismically quiescent area near Youngstown, Ohio, within 1000 m of a deep salt water injection well. This case of induced seismicity has been studied by ODNR (2012), Kim (2013) and Raziperchikolaee and Miller (2015). The latter authors used numerical modeling to test the hypothesis that highly conductive vertical faults connect the target horizons to the deeper hypocentral zone in the Precambrian basement. This brief describes a similar modeling effort using the MATLAB Reservoir Simulation Toolbox (MRST), an open source software application developed by SINTEF Digital (Lie, 2016).
The purpose of this simulation is to model the flow of fluid into the target reservoir and surrounding porous media to correlate the increase in pore pressure with the spatial and temporal distribution of recorded seismicity. The information on well construction, borehole lithology, formation permeability and porosity, daily surface injection pressure and volume are taken from ODNR (2012). The timing and distribution of earthquakes in this sequence has been well-studied by Kim (2013). The unknowns in the simulation are the structure and hydraulic characteristics of the fault/fracture network connecting the target reservoir to the hypocentral zone in the Precambrian crystalline basement. In modeling the hydraulic characteristics of the faults, we rely on the empirical results of the simulation by Raziperchikolaee and Miller (2015). By repeating the numerical simulation of Raziperchikolaee and Miller (2015) we are bench marking the performance of our MRST application.
Earthquakes Caused by Injection into Northstar #1
Northstar #1 became operational in late December 2010. On 17 March 2011, residents in Youngstown felt a Mw 2.3 earthquake. By 13 January 2012, 12 earthquakes (Mw ~1.8–3.9) had been recorded by regional seismographs and six of these had been felt by local residents. At the request of ODNR, personnel from Lamont-Doherty Earth Observatory (LDEO) installed four portable seismographs on 1 December 2011 to monitor the seismicity and provide more precise hypocentral locations. On 24 December 2011 a Mw 2.7 earthquake occurred near the injection well. In response to the increase in seismic activity ODNR requested the operator to shut down the Northstar #1 well on 30 December 2011. Within 24 hours of the order the largest event in the sequence occurred on 31 December 2011 (Mw 3.9). Seismicity continued into February 2012 with a series of very small magnitude events and the LDEO stations were removed (Kim, 2013). After further analysis, ODNR concluded that, based on the spatiotemporal distribution of the events relative to the disposal operation, the earthquakes were induced by fluid injection into Northstar #1 (ODNR 2012).
The MRST Simulation
This MRST simulation requires a grid of cells covering the model space, a rock model that assigns permeability and porosity to each cell, a well model that describes the location of the injection well and its properties, an injection schedule that specifies the volume of fluid injected over time, a fluid model characterizing the physical properties of the injectate (brine in this case), a description of the initial reservoir state and a flow solver to run a simulation through all the time steps given a non-linear physical model, schedule and initial state. The following figures describe how the model was set up and the results obtained, which indicate that the deep east-west striking fault hypothesized by Kim (2013) can experience an increase in pore pressure sufficient to cause slip by hydraulically connecting the borehole to the hypocentral region via highly conductive vertical fractures in the manner suggested by Raziperchikolaee and Miller (2015).

